

___________________________________________________________________________________________
Shipping plays a crucial role in taking New Zealand logs to world markets. Shipping typically accounts for 30% to 40% of the total landed cost in China. Since mid-2024 shipping rates have steadily declined. By the end of May, the Baltic Dry Index, which tracks the cost of shipping dry bulk cargo, had fallen by 27%. This decline followed a period of relative stability, which came after years of extreme fluctuations including a record high. So, what has been driving this trend, and could rates move even lower?
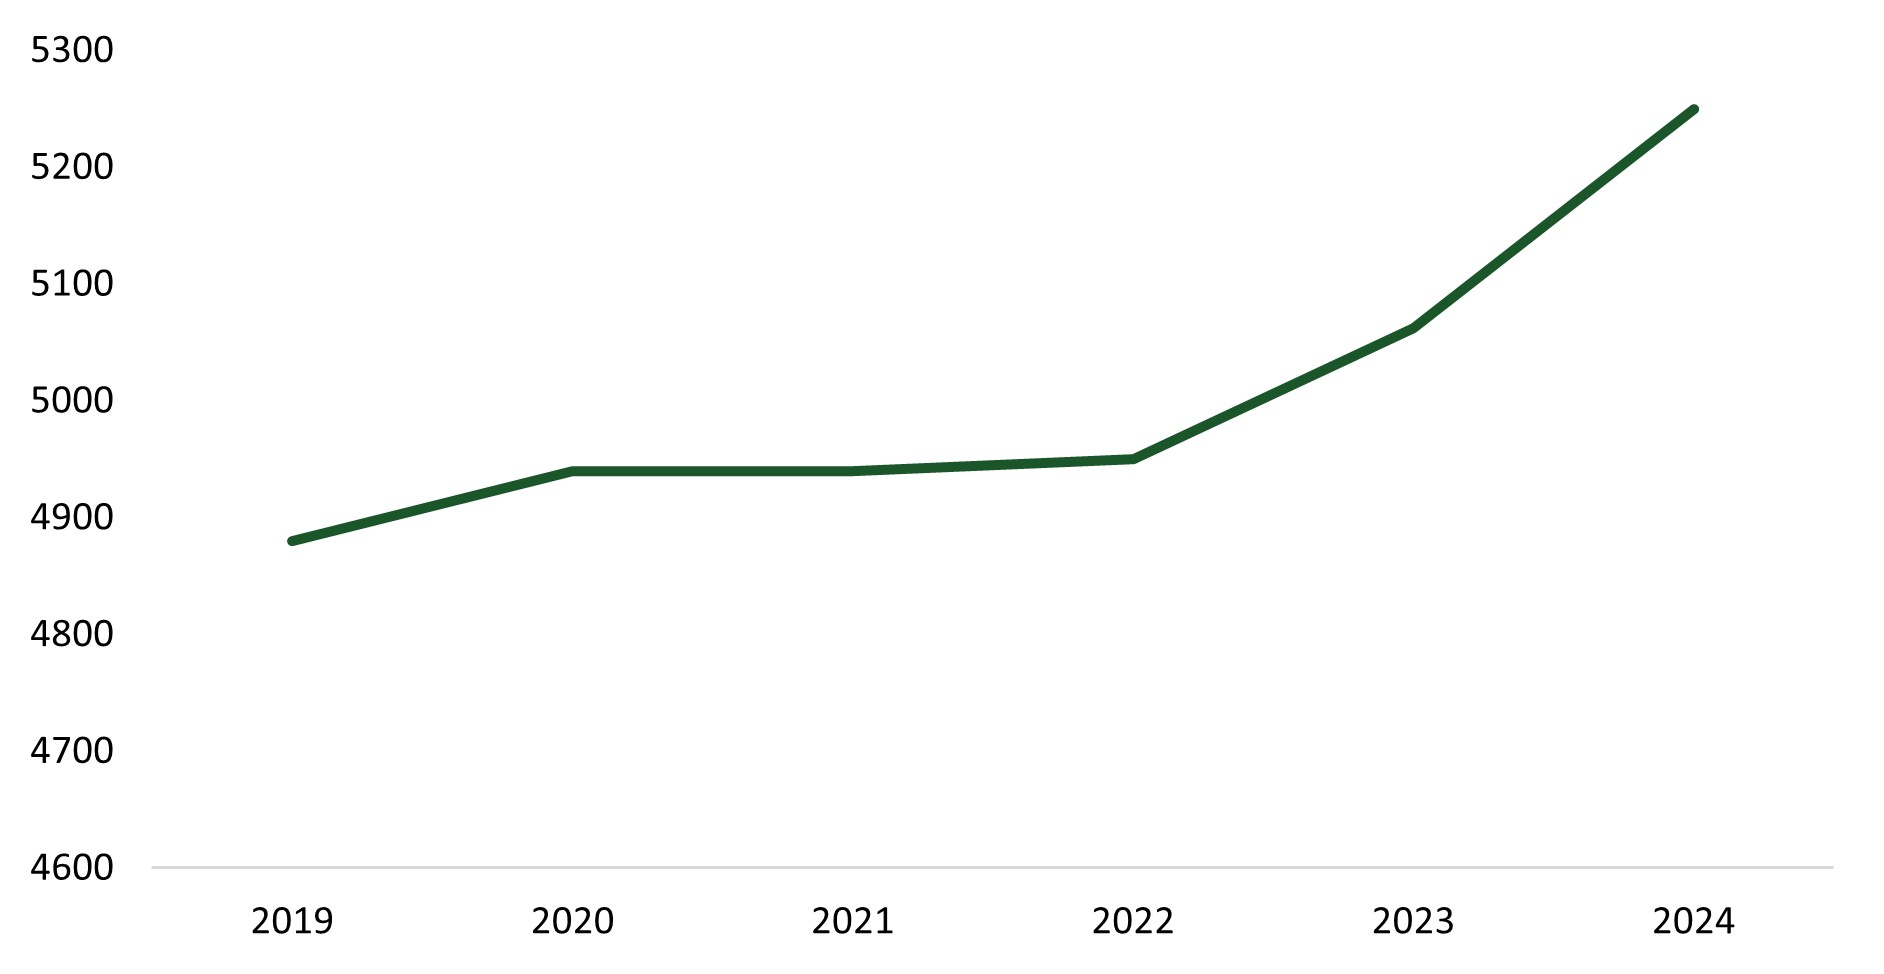
Figure 1. Shipping Rate Indexes

In 2024, global drybulk cargo shipments—including New Zealand logs—reached 5.8 billion tonnes, marking a 12.7% increase from 2019. However, fleet capacity expanded even morerapidly, increasing by 17.3%. Typically, when the supply of shipping outpacesdemand, freight rates tend to fall. Yet, somewhat unexpectedly, the Baltic Dry Index in 2024 was higher than in 2019, suggesting that other factors were also influencing shipping rates
Figure 2. Dry Bulk Fleet Size DWT / Volume Shipped MT

Several global disruptions have constrained the availability of ships, pushing freight rates higher than expected.
A United Nations report confirmed that most of the changes in the Baltic Dry Index in 2023/ 24 have been driven by transit delays in the Panama Canal and security threats in the Red Sea.
Fuelis one of the largest operating costs for ships, and fluctuations in bunker fuel prices have a direct impact on freight rates. After spiking in 2022 due to the global energy shock following the war in Ukraine, bunker fuel prices eased through 2023 and into 2024 as oil markets stabilised and global economic uncertainty reduced demand. In 2025, prices have remained relatively stable,though slightly elevated compared to pre-COVID levels. The introduction of more stringent environmental regulations has also driven up the cost of compliant fuels—such as very low sulphur fuel oil (VLSFO) — and incentivised operators to shift toward alternative fuels like LNG. However, these fuels come at a higher cost and require specialised infrastructure. While lower fuel prices have helped reduce operating costs recently, the long-term outlook is uncertain due to geopolitical risks and the push for decarbonisation, both of which could keep fuel prices volatile and influence future freight rate trends.

The global dry bulk fleet is set to grow. The ratio of new ships on order compared to the current fleet rose from 8% in early 2023 to 12% by early 2025. Oversupply remains a risk, which could push rates lower—especially if global trade slows.
However, ship owners are also investing to meet new environmental targets and improve operating efficiency. While much of the fleet growth is concentrated in larger ships, particularly vessels in the Panamax class (68,000 to 85,000 DWT), shifts inshipping rates in this segment often affect the entire market.
The shipping industry faces strong pressure to reduce greenhouse gas (GHG) emissions. Under new targets set by the International Maritime Organization, emissions must fall byat least 30% by 2030 and reach net zero by 2050. To meet these goals, shipping companies are:
Shipping rates have been falling due to increased ship supply and softening demand. Yet, geopolitical tensions, climate-related disruptions, and trade conflicts havekept rates higher than they might otherwise be.
Looking ahead, shipping capacity is likely to keep growing, as owners respond to trade opportunities and the need to meet environmental targets. Weakening global demand for goods, including softening Chinese demand could put further downward pressure on rates. On the upward side, India’s coal consumption is expected to increase, while Brazil is expected to export massive soybean volumes to China. All this suggests that the future direction of ocean freight continues to be uncertain